10 Best Ways to Reduce Energy Use in Wear Resistant Industrial Systems?

Time:2026-09-17 Author:Charlotte
0%

Industrial wear systems often consume more power than their production figures suggest. Conveyors, crushers, mixers, pumps, and cutting tools work against friction, impact, and heat. When liners wear unevenly, motors compensate with higher torque. A small vibration can become a large electricity bill.

This guide examines ten practical ways to Reduce energy consumption of wear-resistant industrial systems. The recommendations reflect maintenance experience, engineering principles, and measurable operating conditions. They include selecting suitable wear materials, controlling alignment, improving lubrication, and monitoring load changes. Each measure should be tested against production targets, safety requirements, and equipment manufacturer guidance.

Numbers matter. Measure the losses.

A motor running at 85% load behaves differently from one surging between 40% and 110%. Temperature readings, vibration trends, power-factor data, and inspection photographs can reveal hidden losses. A worn chute liner may increase material resistance, while an over-tightened belt may waste energy continuously. These details are easy to overlook.

Real plants are rarely perfect. Dust disrupts sensors. Operators inherit old settings. Budget limits delay upgrades. That is why energy reduction should begin with a baseline, not a promise. Compare power use per tonne, operating hours, reject rates, and downtime before changing equipment. Some improvements may produce smaller savings than expected. That result still teaches the team where effort belongs.

The following ten approaches connect durability with efficiency. They focus on practical decisions that can be inspected, measured, and improved over time.
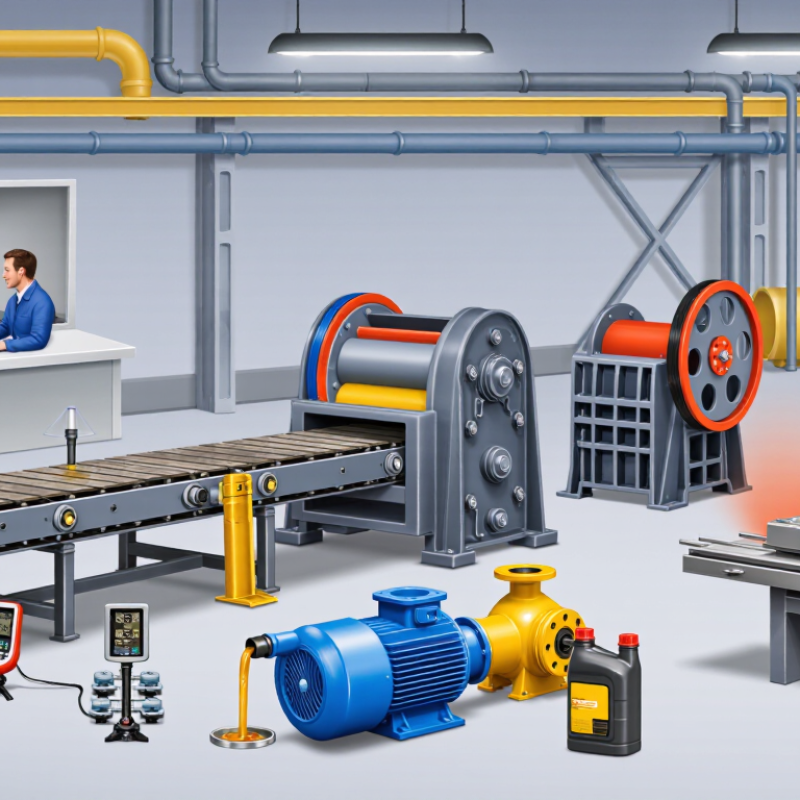
10 Best Ways to Reduce Energy Use in Wear Resistant Industrial Systems?

Understanding Energy Use in Wear-Resistant Industrial Systems

Energy use in wear-resistant industrial systems is rarely caused by one component. Motors, pumps, conveyors, fans, and compressed-air lines often share the load. Friction adds hidden demand when abrasive materials move across chutes, liners, or transfer points. A rough surface can increase motor current, even when production appears normal. Heat provides another clue. Warm bearings, glowing couplings, or hot hydraulic oil may indicate wasted energy and developing damage.

Practical energy reduction begins with measurement. Record motor current, flow rate, pressure, operating hours, and material throughput. Compare these readings during normal and peak production. Inspect transfer points for buildup and misalignment. Clean surfaces reduce drag. Correct belt tension also prevents unnecessary resistance. In pumping systems, removing oversized restrictions can lower pressure losses. Variable-speed control may help when demand changes throughout the shift. Small leaks matter. A compressed-air leak can sound harmless but run continuously.

Durable wear surfaces can reduce replacement work, yet hardness alone does not guarantee efficiency. The wrong geometry may create turbulence, impact, or material blockage. I have seen maintenance teams replace a liner repeatedly without checking its angle. That assumption can fail. Energy savings should be verified after each change, not estimated from appearance. Keep a simple trend log beside the equipment. Note unusual noise, temperature, vibration, and power readings. Some improvements will disappoint. That is useful evidence, not wasted effort. Reliable decisions come from measured performance, safe inspections, and realistic operating conditions.

Evaluating Equipment Efficiency and Identifying Energy Losses

Reducing energy use in wear-resistant industrial systems begins with measuring actual performance, not relying on equipment ratings. Track kilowatt-hours per ton, motor load, production volume, and operating hours during normal shifts. A crusher consuming more power while producing less material may have worn liners, poor feed control, or blocked discharge areas. Small changes often reveal larger losses.

Inspect the full system, including conveyors, pumps, drives, bearings, and dust-control equipment. Listen for unusual vibration and check bearing temperatures during production. Compare pressure readings before and after filters or pipelines. A rising pressure drop can indicate clogging, leakage, or excessive resistance. Record idle time carefully. Motors running without material flow waste energy quietly.

Our first assessment once focused only on the main motor. That was incomplete. Auxiliary equipment used significant power during repeated starts and short stoppages. We also found that operators adjusted feed rates by habit, rather than measured demand. Simple control improvements reduced cycling, but the result was not perfectly consistent. Material hardness changed between batches, and some readings were taken too quickly.

Use calibrated meters and repeat measurements under similar loads. Maintenance teams should connect energy data with wear patterns, repair records, and production quality. A lower energy figure is not automatically better if it causes premature wear or unstable output. Review the findings with experienced operators and qualified engineers. Their observations can explain problems that a dashboard misses.

10 Best Ways to Reduce Energy Use in Wear Resistant Industrial Systems? - Evaluating Equipment Efficiency and Identifying Energy Losses

Practical engineering benchmarks for abrasive-material handling, processing, pumping, conveying, and compressed-air systems

No. Energy-Reduction Method Primary Equipment Typical Energy Loss or Inefficiency Recommended Action Typical Energy-Reduction Potential Indicative Payback Best Measurement
1 Use variable-speed control Slurry pumps, fans, blowers, feeders, and conveyors Fixed-speed equipment throttled by valves, dampers, or mechanical restrictions Apply a properly sized variable-frequency drive where process demand varies; verify motor cooling and minimum-speed limits. 10–35% 1–3 years Electrical power, flow rate, pressure, and operating hours
2 Optimize pump and piping design Abrasive slurry and process-water pumps Oversized pumps, excessive friction, unnecessary bends, and high-pressure throttling Match the duty point to the best-efficiency region, reduce avoidable pressure drop, and maintain suitable slurry velocity. 8–25% 1–4 years Pump curve, differential pressure, flow, density, and motor kW
3 Improve conveyor loading and routing Belt, screw, and chain conveyors Low load factor, excessive incline, belt slip, misalignment, and unnecessary transfer points Maintain stable loading, shorten conveying routes where practical, correct alignment, and eliminate empty running. 5–20% 0.5–2 years Motor kW per tonne conveyed, belt speed, load rate, and runtime
4 Reduce compressed-air losses Pneumatic valves, actuators, cleaning tools, and air nozzles Leaks, excessive pressure, open blowing, and inappropriate use of compressed air Repair leaks, install engineered air nozzles, lower pressure to the minimum required, and prohibit open-ended hoses. 10–30% Less than 1 year Compressor kW, system pressure, flow during non-production, and ultrasonic leak survey
5 Maintain wear surfaces and clearances Chutes, liners, impellers, hydrocyclones, valves, and pipe sections Erosion increases leakage, turbulence, recirculation, friction, and pressure drop Use condition-based inspection, replace worn components before efficiency declines, and verify design clearances. 3–15% 0.5–2 years Pressure drop, vibration, flow, wear thickness, and motor load
6 Optimize grinding and crushing duty Crushers, mills, screens, and classification equipment Overgrinding, recirculating load, poor feed distribution, and operation outside the efficient range Control feed size and moisture, maintain correct classification, and align operating targets with the required product specification. 5–20% 1–3 years Specific energy, tonnes per hour, product size distribution, and recirculating load
7 Improve motor and drive efficiency Motors, gearboxes, couplings, and drive systems Motor oversizing, poor power factor, misalignment, belt losses, and inefficient part-load operation Select efficient motors for replacement projects, correct alignment, inspect couplings, and avoid unnecessary oversizing. 2–10% 2–6 years Input kW, motor load factor, current balance, temperature, and power factor
8 Recover heat and improve insulation Dryers, kilns, hot-air systems, steam lines, and process tanks Heat escaping through surfaces, exhaust air, hot product, and poorly controlled combustion Repair insulation, recover exhaust heat where compatible, seal openings, and tune temperature controls. 5–25% 1–4 years Fuel or thermal-energy use, surface temperature, exhaust temperature, and moisture removal
9 Automate idling and standby control Conveyors, pumps, dust collectors, screens, and auxiliary systems Equipment continues running during gaps, shift changes, blocked flow, or empty production periods Use interlocks, timers, sequence control, and production-linked start/stop logic with safe restart procedures. 5–20% 0.5–2 years Runtime by operating state, kW during idle periods, and production schedule
10 Install energy monitoring and loss accounting Plant electrical, thermal, hydraulic, and compressed-air systems Unmeasured peaks, abnormal baseload, hidden leaks, and poor allocation of energy to production areas Submeter major loads, establish specific-energy baselines, trend deviations, and prioritize corrective actions by cost and impact. 3–12% 0.5–3 years 15-minute energy data, production volume, peak demand, and equipment-level submetering

Interpretation: The reduction percentages are typical engineering ranges for individual improvement measures, not additive guarantees. Actual results depend on duty cycle, material abrasiveness, equipment condition, process requirements, control strategy, and local energy prices.

Recommended baseline: Establish at least two to four weeks of measured energy and production data before implementation, then compare kWh per tonne, thermal energy per tonne, pressure drop, flow, and operating hours after the change.

Improving Material Selection, Design, and Operating Conditions

10 Best Ways to Reduce Energy Use in Wear Resistant Industrial Systems

Material selection often decides whether energy is lost quietly. The International Energy Agency’s Energy Efficiency 2023 report states that industry consumed roughly 37% of global final energy in 2022. In abrasive service, choose wear-resistant materials according to impact, sliding, temperature, and corrosion exposure. Harder is not always better. A brittle lining can crack, increase friction, and demand repeated replacement. Test samples under real load, not only laboratory conditions. Compare lifecycle energy, machining effort, mass, and service life before approving a material.

Design should remove unnecessary resistance. Shorter flow paths reduce pressure loss. Smooth transitions limit turbulence and particle impact. Correct clearances prevent rubbing between moving parts. Use replaceable wear zones instead of replacing entire assemblies. Align shafts carefully, balance rotating components, and reduce dead weight where strength permits. The U.S. Department of Energy’s Industrial Decarbonization Roadmap identifies efficiency improvements as a near-term industrial priority. Small design changes matter. Sometimes, the drawing is the real energy problem.

Operating conditions complete the picture. Maintain stable feed rates, avoid overloading, and monitor vibration, temperature, pressure, and motor current. Lubricate only as specified; excess lubricant can increase drag and contamination. Variable-speed control can reduce energy during partial-load operation, especially in fans, pumps, and conveyors. The IEA reports that stronger industrial efficiency could significantly reduce future energy demand, but site results vary. That limitation matters. Record baseline consumption, inspect wear patterns monthly, and challenge assumptions when the data disagrees. Perfect optimization is unlikely. Measured improvement is practical.

10 Best Ways to Reduce Energy Use in Wear-Resistant Industrial Systems

Typical energy-reduction potential from material selection, equipment design, and operating-condition improvements

The percentages represent practical benchmark values commonly reported for industrial efficiency measures. Actual results depend on equipment condition, duty cycle, process loads, and maintenance quality. Savings from individual measures should not be added directly because opportunities can overlap.

Reference basis: U.S. Department of Energy guidance on compressed-air systems, motor systems, variable-speed drives, and industrial energy efficiency.

Applying Maintenance, Automation, and Energy Recovery Strategies

Wear-resistant industrial systems often consume energy through friction, pressure losses, and avoidable downtime. Maintenance is an energy strategy, not merely a reliability task. A worn seal can force a conveyor drive to work harder, while abrasive dust can block filters and increase fan load. The U.S. Department of Energy reports that compressed-air leaks commonly waste 20–30% of compressor output. Ultrasonic leak surveys, pressure trending, and scheduled lubrication can expose these losses before they become normal operating costs.

Automation adds sharper control. Sensors can monitor motor current, vibration, temperature, and hydraulic pressure in real time. A control system can reduce speed during empty runs or adjust airflow when material demand falls. DOE guidance notes that variable-speed control can reduce energy use in suitable pump and fan applications, but only after engineers confirm the operating range. Automation is not automatically efficient. Poorly tuned sensors may create constant speed changes, extra wear, or false alarms.

Energy recovery deserves practical attention. Regenerative drives can return braking energy to a shared electrical system, especially on descending conveyors, hoists, and frequent-stop equipment. The International Energy Agency identifies motor-driven systems as a major industrial efficiency opportunity. Still, recovery depends on timing, storage capacity, and equipment compatibility. A small pilot with measured kilowatt-hours is safer than a large promise. The first result may disappoint, and that is useful evidence. Records should compare production output, maintenance events, and energy per tonne, not electricity alone.

Measuring Results and Building a Continuous Energy Reduction Plan

Wear-resistant systems often hide energy losses behind durable components. Crushers, conveyors, pumps, and mills may run reliably while consuming excessive power. The IEA’s Energy Efficiency 2023 report estimates that industry uses about 37% of global final energy. That makes measurement essential.

Start with a twelve-month baseline. Record kilowatt-hours per tonne, throughput, operating hours, moisture, and material hardness. Install submeters near major drives and compare readings with production records. Measure energy first. A simple dashboard can reveal rising load after liner wear, belt misalignment, or blocked chutes. The ISO Survey 2022 recorded 21,846 ISO 50001 certificates worldwide, showing the growing use of structured energy management. However, certification alone does not prove savings.

Set monthly targets for each asset. Inspect motor current, bearing temperature, pressure drop, and vibration during normal production. Then connect maintenance findings with energy results. A worn liner may increase impact losses. Poor lubrication may raise friction before failure appears. Small errors compound. The U.S. Department of Energy’s Industrial Decarbonization Roadmap identifies efficiency improvements as an immediate industrial opportunity, but site conditions still matter more than generic targets. Review the plan every quarter, and adjust for production changes. Do not guess. One imperfect baseline can distort the entire program, so operators should document missing data, test assumptions, and repeat measurements after every major repair.

FAQS

How can I measure energy efficiency in a wear-resistant industrial system?

Track kilowatt-hours per ton, motor load, production volume, and operating hours. Measure during normal shifts. A lower energy figure may hide unstable output.

What signs suggest that a crusher is wasting energy?

Higher power use with lower material output is a warning sign. Worn liners, poor feed control, or blocked discharge may cause it. Small changes matter.

Which equipment should an energy inspection include?

Inspect conveyors, pumps, drives, bearings, and dust-control equipment. Check vibration and bearing temperatures during production. Motors can waste energy while running empty.

How can pressure readings reveal energy losses?

Compare pressure before and after filters or pipelines. A growing pressure drop may indicate clogging, leakage, or excessive resistance. Record readings under similar loads.

Why should auxiliary equipment be included in energy reviews?

Fans, pumps, conveyors, and other equipment can consume substantial power during starts and stoppages. Our earlier review focused too narrowly on the main motor. That was incomplete.

How does material selection affect energy consumption?

Select materials for impact, sliding, temperature, and corrosion conditions. Harder material is not always better. A brittle lining may crack, increase friction, and need frequent replacement.

What design changes can reduce resistance?

Shorter flow paths reduce pressure loss. Smooth transitions limit turbulence and particle impact. Correct clearances prevent rubbing. Replaceable wear zones can reduce unnecessary replacement work.

How can operating conditions improve efficiency?

Maintain stable feed rates and avoid overloading. Monitor vibration, temperature, pressure, and motor current. Variable-speed control can reduce energy during partial-load operation.

How reliable are quick energy measurements?

They may be misleading. Material hardness can change between batches, and short readings can miss real conditions. Repeat measurements with calibrated meters and similar loads.

Is the lowest energy result always the best result?

No. Lower consumption may cause premature wear or unstable production. Compare energy data with repair records, wear patterns, and product quality. Perfect optimization is unlikely.

Conclusion

Reducing energy use in wear-resistant industrial systems begins with understanding where and how energy is consumed across equipment, processes, and operating conditions. A detailed review of motors, drives, pumps, conveyors, and material-handling components can reveal losses caused by friction, misalignment, excessive loads, inefficient settings, and unnecessary idling. Selecting durable materials and optimizing component design can reduce resistance while extending service life. Adjusting speed, pressure, temperature, and production schedules also helps equipment operate closer to its ideal efficiency.

To reduce energy consumption of wear-resistant industrial systems, organizations should combine preventive maintenance with automation, real-time monitoring, and practical energy recovery methods. Regular inspections, lubrication, alignment checks, and timely replacement of worn parts prevent efficiency decline. Performance should be measured using clear indicators such as energy use per unit of output, operating hours, and maintenance-related losses. Reviewing these results regularly supports a continuous improvement plan that delivers lower energy demand, improved reliability, and more sustainable industrial performance.

Charlotte

Charlotte

Charlotte is a seasoned marketing professional with a deep understanding of the company's portfolio and a passion for elevating its presence in the market. With a keen eye for detail and a commitment to excellence, she ensures that our professional blog is regularly updated with insightful articles......